Best On-Chain NFT Analytics Platforms for Investors
 by
Best On-Chain NFT Analytics Platforms for Investors
Navigating the non-fungible token market requires far more than tracking social media momentum, celebrity endorsements, or community chat activity. While early speculative cycles often rewarded hype-driven buying, mature market conditions demand disciplined research backed by verifiable data. Because non-fungible tokens are inherently illiquid, high-variance digital assets, making capital allocation decisions without objective data exposes investors to severe downside risks, artificial volume manipulation, and mispriced entry points.
NFT analytics platforms solve this problem by translating raw, immutable blockchain records into structured, actionable intelligence. Rather than relying on surface-level narratives, investors can examine real-time wallet flows, historical floor price resilience, holder concentration, and authentic liquidity before committing capital. Whether evaluating blue-chip digital collectibles, gaming assets, or emerging generative art collections, data-driven due diligence separates calculated investing from blind speculation.
This guide serves as an investor-focused comparison of the leading tools available for researching digital collectibles. We will explore how on-chain data extraction works, examine the core metrics every investor must monitor, and evaluate eight prominent platforms—distinguishing between pure on-chain intelligence providers, marketplace data terminals, and infrastructure APIs. Finally, we will outline clear selection criteria, practical analytical workflows, and the inherent limitations of relying solely on blockchain metrics.
What Is On-Chain NFT Analytics?
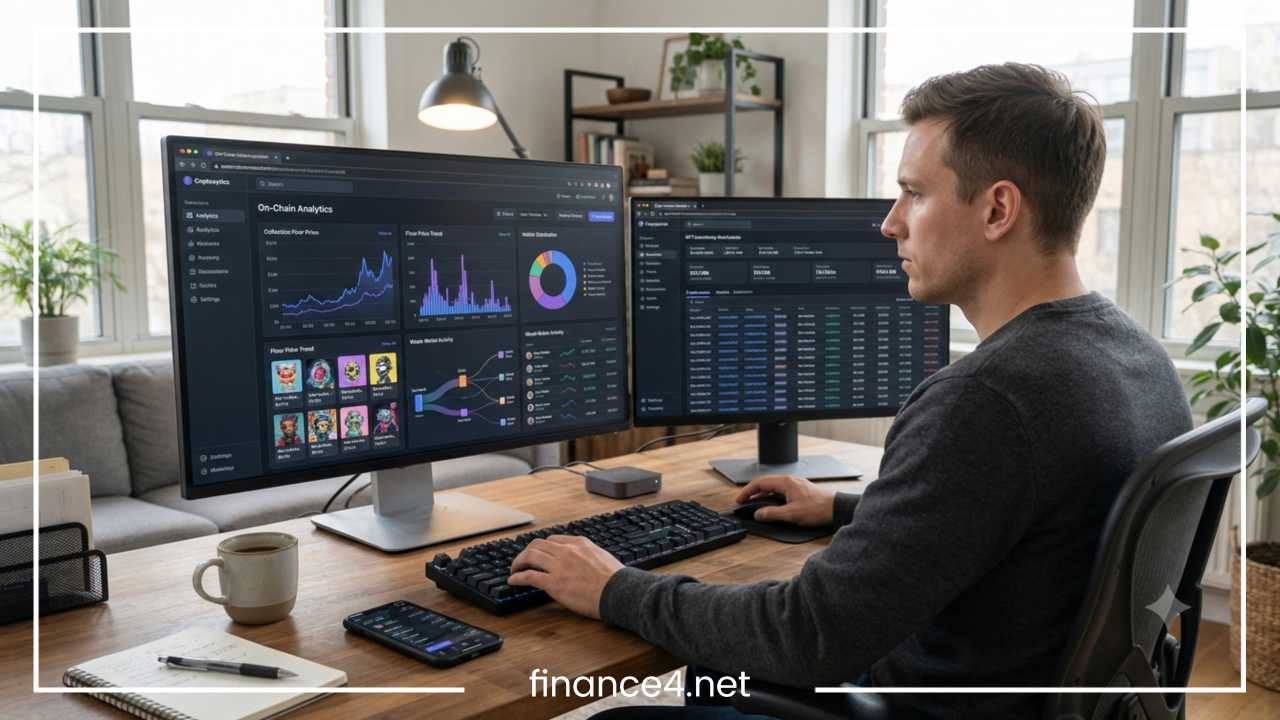
On-chain NFT analytics refers to the systematic collection, indexing, decoding, and interpretation of transaction and ownership records stored directly on public blockchains. Every time a non-fungible token is minted, transferred, listed for sale, bid upon, or purchased via a smart contract, that event is permanently recorded on a distributed ledger such as Ethereum, Solana, Polygon, or Base. Specialized analytical software monitors these smart contract interactions in real time, structuring complex cryptographic logs into human-readable charts, wallet profiles, and collection health indicators.
The primary advantage of this approach lies in radical transparency. In traditional art, collectibles, or private equity markets, transaction histories, ownership distributions, and bid-ask spreads are frequently opaque, delayed, or privately brokered. Conversely, public blockchains expose the exact movement of every individual token from its creation to its current holder. Investors can verify how many unique addresses hold a specific collection, trace whether early insiders are quietly liquidating their positions, and observe how much genuine capital is entering or exiting an ecosystem.
It is essential to distinguish between dedicated on-chain analytics and traditional NFT market tracking. Basic market trackers typically aggregate simple listing prices and daily sales volume from major marketplaces, offering a surface-level snapshot of current retail sentiment. True on-chain analytics goes much deeper by linking wallet addresses to historical behavioral patterns, clustering related accounts, filtering out artificial wash trades, and evaluating token velocity across decentralized protocols.
To deliver these insights, analytics platforms operate specialized blockchain nodes and indexing pipelines that continuously parse smart contract events (such as ERC-721 and ERC-1155 transfers) alongside off-chain metadata like image traits and rarity attributes. For long-term investors, mastering these tools transforms market observation from reactive price-watching into proactive fundamental analysis, enabling smarter entry timing, risk management, and portfolio rebalancing.
Key Metrics NFT Investors Should Track
Before selecting an analytics suite, investors must understand the foundational metrics that reveal a collection’s true market health and risk profile. Relying on a single headline figure often leads to flawed conclusions; effective analysis requires cross-referencing multiple indicators simultaneously.
-
Floor Price: The lowest active asking price for an item within a specific collection across integrated marketplaces. While widely used as a baseline valuation metric, floor price only reflects the cheapest available listing rather than the value of rare traits or the depth of actual buyer demand at that price level.
-
Trading Volume: The total monetary value of all completed NFT transactions within a collection over a chosen timeframe, typically measured in native tokens like ETH or SOL as well as USD equivalents. Sustained volume indicates active market participation, whereas sudden spikes warrant closer inspection for potential manipulation.
-
Sales History: The chronological record of completed transactions, including individual sale prices, timestamps, and specific token identifiers. Examining sales history helps investors identify support and resistance levels, spot panic-selling episodes, and verify whether items consistently clear near the floor price or at substantial discounts via accepted bids.
-
Unique Holders: The total count of distinct wallet addresses holding at least one token from a given collection. Comparing unique holders against total supply yields the unique ownership ratio; a higher ratio generally signals broad retail distribution and healthier community decentralization.
-
Holder Distribution: A granular breakdown showing how many tokens each wallet holds—for example, the percentage of holders owning one item versus those holding ten or more. Heavy concentration among a small cluster of wallets increases the risk of sudden supply shocks if large holders decide to exit simultaneously.
-
Whale Activity: The buying, selling, minting, and transfer behaviors of high-net-worth wallets holding substantial capital or prominent blue-chip portfolios. Tracking whale accumulation can highlight emerging conviction, while coordinated whale outflows often precede broader floor price declines.
-
Market Liquidity: A measure of how quickly and efficiently an NFT can be converted into cryptocurrency without causing significant price slippage. High liquidity is characterized by tight spreads between the lowest listing price and the highest standing collection bid, alongside consistent daily transaction turnover.
-
Wallet Activity: Behavioral patterns at the individual address level, including average holding periods, historical realized profit and loss, minting frequency, and cross-collection rotation. Analyzing wallet cohorts helps investors determine whether buyers are long-term collectors or short-term momentum flippers.
-
Wash Trading Indicators: Algorithmic flags that identify suspicious transactions where the same entity—or a coordinated group of wallets—buys and sells the same asset repeatedly to artificially inflate volume, farm token rewards, or create an illusion of organic demand.
-
Rarity and Trait Analysis: Statistical evaluations of how scarce specific visual or functional attributes are within a collection, paired with historical price premiums paid for those traits. Understanding trait floors prevents investors from overpaying for common items or undervaluing rare assets during market downturns.
Best On-Chain NFT Analytics Platforms for Investors
Selecting the right research environment requires understanding the structural differences between available tools. Some platforms function as pure on-chain intelligence engines focused on wallet attribution and custom data queries, while others operate as high-speed trading terminals or developer-grade data infrastructure providers. Below is an investor-focused breakdown of eight leading platforms shaping modern NFT research.
Nansen
Nansen is an institutional-grade on-chain intelligence platform renowned for its proprietary wallet labeling and entity attribution system. By tagging hundreds of millions of blockchain addresses across major networks, Nansen allows investors to see not just what transactions are occurring, but who is behind them. Its dedicated NFT dashboards track capital inflows, floor price momentum, minting trends, and holder demographics in real time.
The platform’s standout capability is Smart Money tracking, which monitors the live portfolios and trading moves of historically profitable collectors, venture funds, and high-performing traders. Investors can set custom alerts whenever top-tier wallets accumulate a specific collection or exit long-held positions. While Nansen requires a paid subscription for full access and lacks built-in order execution for casual browsers, it remains unmatched for investors seeking deep behavioral context and whale intelligence.
Dune
Dune is a community-powered blockchain analytics platform that gives users direct access to raw, decoded smart contract data through a web-based SQL query engine. Rather than locking investors into rigid, pre-built interfaces, Dune enables analysts and data-driven investors to write custom queries or explore thousands of publicly shared dashboards covering NFT marketplace market share, royalty flows, holder retention, and bespoke wash-trading filters.
Because its datasets span Ethereum, Solana, Polygon, Base, and numerous Layer 2 networks, Dune excels at cross-ecosystem macro research and granular forensic investigations. Its free tier allows anyone to browse existing dashboards, though creating private queries and exporting data requires paid plans. The primary limitation is a steeper learning curve: investors without SQL proficiency must rely on community-maintained dashboards, which can occasionally become outdated if creators stop maintaining their queries.
CryptoSlam
CryptoSlam is a multi-chain NFT data aggregator focused on macro market rankings, cross-blockchain volume comparisons, and verified historical sales tracking. Unlike tools geared toward high-frequency Ethereum sniping, CryptoSlam indexes transactions across dozens of distinct blockchains—including Ethereum, Solana, Bitcoin Ordinals, Polygon, Mythos, and Flow—making it a premier resource for comparing ecosystem-level adoption.
Investors use CryptoSlam to evaluate long-term sales trajectories, buyer-to-seller ratios, and historical price performance across market cycles. The platform applies standardized filtering methodologies to remove suspicious wash trades from its headline leaderboards, helping researchers separate genuine multi-chain growth from artificial inflation. While it does not offer advanced real-time wallet clustering or automated trading execution, its clean, accessible interface and deep historical datasets make it indispensable for macro-oriented portfolio allocation.
NFTGo
NFTGo is an all-in-one NFT market intelligence and data aggregation platform designed specifically for active collectors and fundamental investors. It combines real-time collection rankings, market capitalization estimates, liquidity scores, and holder distribution charts within an intuitive visual workspace. One of its core analytical strengths is its algorithmic wash-trading filter, which automatically strips out cyclical self-trades to display adjusted, authentic volume and floor metrics.
In addition, NFTGo features a transparent rarity scoring model alongside dedicated whale tracking dashboards that highlight large-scale acquisitions, minting activity, and custom watchlist alerts. Investors can inspect individual wallet profit-and-loss histories and assess collection health through clear supply-and-demand indicators. Although its cross-chain coverage is narrower than broad macro aggregators like CryptoSlam, NFTGo offers one of the most balanced, user-friendly toolkits for everyday collection due diligence.
OpenSea
OpenSea is primarily recognized as a leading multi-chain NFT marketplace, yet its integrated analytics views serve as an essential research starting point for millions of retail and institutional investors. Because OpenSea aggregates listings, collection offers, and historical transfer logs across Ethereum, Polygon, Base, Arbitrum, and other networks, its collection analytics tabs provide immediate visibility into active listing ratios, floor price charts, and granular trait-level pricing.
Investors frequently pair OpenSea with dedicated intelligence tools to verify real-time order book depth, inspect individual token provenance, and evaluate how quickly newly listed items are absorbed by buyers. While OpenSea lacks sophisticated wallet labeling, cohort profitability metrics, or custom SQL querying, combining direct marketplace execution with transparent listing distribution data makes it a practical everyday hub for monitoring retail liquidity and discovering emerging collections.
Blur
Blur is a professional-grade NFT marketplace and aggregator engineered specifically for active, high-frequency traders and liquidity providers. Rather than separating research from execution, Blur embeds sub-second on-chain market feeds directly into an order-book style trading terminal. Its analytical interface displays live floor depth charts, real-time sales tickers, pending transaction mempool visibility, and granular trait floor comparisons with minimal latency.
The platform’s most valuable analytical feature for investors is its bid pool visibility, which maps out exact standing liquidity at every price tier below the current floor. This enables investors to gauge downside price support and calculate realistic exit liquidity before entering a position. However, because Blur incentivizes active bidding and rapid turnover, its volume metrics can reflect aggressive short-term liquidity farming rather than organic long-term collector conviction, requiring careful interpretation.
Icy.tools
Icy.tools is a real-time NFT market monitoring and discovery platform built to help investors spot emerging trends, live mints, and sudden shifts in collection momentum. Its streamlined dashboards track live sales feeds, floor price movements, and trading volume spikes across short time intervals—such as 15-minute, hourly, and daily windows—allowing users to detect early capital rotation before broader market awareness sets in.
The platform also provides wallet-level portfolio tracking, historical sales charts, and custom alert notifications for floor price thresholds or specific wallet transactions. Investors value Icy.tools for its speed and uncluttered presentation during active mint phases or volatile market sessions. While its deeper forensic capabilities and multi-chain breadth are more modest than enterprise suites like Nansen, it serves as a reliable tactical radar for tracking real-time Ethereum collection velocity.
Reservoir
Reservoir operates differently from consumer-facing dashboards: it is a foundational NFT data and liquidity infrastructure provider built for quantitative investors, developers, and analytical teams. Reservoir indexes real-time order books, ownership records, floor prices, and historical sales across major marketplaces and Ethereum-compatible networks, delivering normalized data through high-speed APIs and indexed SQL tables.
For sophisticated investors who prefer building proprietary valuation models, automated trading bots, or custom portfolio trackers, Reservoir eliminates the engineering burden of running raw blockchain nodes and parsing disparate marketplace smart contracts. Its structured datasets are even integrated into external research environments like Dune, bridging the gap between raw infrastructure and visual exploration. While non-technical retail investors will not use Reservoir as a standalone point-and-click website, it powers much of the underlying data accuracy across modern Web3 analytics applications.
Comparison of Leading On-Chain NFT Analytics Platforms
| Platform | Category | Standout Analytics Features | Primary Blockchain Coverage | Ideal Investor Profile |
| Nansen | On-Chain Intelligence | Wallet labeling, Smart Money tracking, entity flows, custom alerts | Ethereum, Solana, Polygon, Base, Arbitrum, major EVM chains | Institutional investors and research-driven whale trackers |
| Dune | Custom Data Platform | Raw SQL querying, community dashboards, custom wash-trade logic | Ethereum, Solana, Polygon, Base, Bitcoin, multi-chain EVM | Data-driven analysts and researchers needing custom metrics |
| CryptoSlam | Macro Data Aggregator | Multi-chain volume rankings, historical sales, buyer/seller ratios | 20+ chains including Ethereum, Solana, Bitcoin, Polygon, Flow | Macro researchers comparing ecosystem-wide historical trends |
| NFTGo | Market Intelligence | Wash-trade filtering, whale signals, rarity scoring, liquidity metrics | Ethereum and major EVM networks | Fundamental collectors and active mid-to-long-term investors |
| OpenSea | Marketplace Analytics | Listing distribution, trait floors, item provenance, offer history | Ethereum, Polygon, Base, Arbitrum, Optimism, Avalanche | Retail and everyday investors combining research with trading |
| Blur | Trading Terminal | Sub-second feeds, bid-pool depth charts, live floor ladders | Ethereum and Blast | High-frequency traders and active liquidity providers |
| Icy.tools | Real-Time Tracker | Live mint feeds, short-timeframe volume spikes, wallet alerts | Ethereum | Tactical traders monitoring emerging momentum and live drops |
| Reservoir | Data Infrastructure | Normalized order-book APIs, ownership indexing, SQL data tables | Ethereum, Polygon, Base, Arbitrum, Optimism, major EVM chains | Quantitative analysts and developers building custom research tools |
How to Choose the Right NFT Analytics Platform
With distinct tools serving different stages of the investment process, choosing the right platform depends on your strategy, technical comfort, and portfolio focus. Evaluating candidate platforms across eight practical dimensions ensures you select a stack that genuinely improves decision-making.
-
Blockchain Coverage: Confirm that the platform natively indexes the networks where you deploy capital. An Ethereum-focused terminal offers little value if your portfolio centers on Solana compressed NFTs, Bitcoin Ordinals, or Base gaming ecosystems.
-
Data Accuracy: Prioritize platforms that reconcile raw smart contract events rather than relying solely on third-party marketplace APIs. Accurate indexing ensures peer-to-peer transfers, OTC trades, and multi-marketplace sweeps are properly accounted for without double-counting.
-
Real-Time Tracking: Latency matters differently depending on your time horizon. Short-term traders sniping underpriced listings or trading volatile mints require sub-second updates, whereas long-term thesis investors can operate effectively with hourly or daily aggregations.
-
Wallet Intelligence: Look for platforms that enrich raw hexadecimal addresses with behavioral context—such as entity tags, realized profit-and-loss history, and wallet clustering—so you can distinguish between organic retail adoption and coordinated insider activity.
-
Historical Data: Robust multi-year transaction records are vital for stress-testing how a collection performs during broader cryptocurrency drawdowns, evaluating whether floor prices hold established support zones over time.
-
User Experience: Clean visual hierarchy, responsive charts, and customizable watchlists reduce cognitive overload. If a dashboard buries critical liquidity metrics beneath cluttered widgets, you are less likely to conduct consistent due diligence.
-
Pricing and Accessibility: Weigh subscription costs against your total portfolio size and trading frequency. Many investors achieve strong results by pairing free tiers on platforms like Dune, CryptoSlam, and Blur with targeted paid subscriptions only when capital deployment justifies the expense.
-
API and Customization: If you maintain custom spreadsheets, quantitative valuation models, or automated alert scripts, verify whether the platform provides reliable API endpoints, CSV exports, or customizable SQL querying.
How Investors Can Use On-Chain NFT Analytics to Make Better Decisions
Possessing access to raw blockchain data only creates an edge when translated into repeatable research habits. Disciplined investors integrate on-chain analytics into every phase of their workflow—from initial discovery to position sizing and exit planning.
Identify Undervalued Collections Through Historical Divergences
Rather than chasing assets after parabolic price spikes, investors can screen for collections where floor prices have compressed significantly while unique holder counts and organic transfer activity remain steady. Comparing current prices against multi-month historical sales distributions helps pinpoint resilient projects trading near established structural support.
Monitor Whale Wallets for Early Conviction
By building watchlists of wallets with proven track records of early accumulation in successful collections, investors can observe where sophisticated capital is rotating. Seeing multiple unrelated Smart Money wallets quietly sweep floor items over several weeks provides a far stronger signal than promotional social media threads.
Evaluate Holder Concentration Before Entering
Before buying into any collection, inspect the holder distribution curve and check what percentage of the total supply sits in the top ten or top fifty wallets. If a handful of early minters or team-affiliated addresses control a disproportionate share of tokens, position sizing should be reduced to account for potential distribution overhang.
Detect Artificial Volume and Wash Trading
Always compare headline trading volume against unique buyer counts and wash-trade-adjusted metrics. If a collection generates massive daily volume across only a few dozen recurring wallet pairs—often trading high-value items back and forth at zero marketplace fees—the volume is likely manufactured to attract unsuspecting retail buyers.
Analyze Collection Liquidity and Bid Depth
Before committing significant capital, examine the order book depth and ratio of listed items to total supply. A healthy collection typically exhibits a low listing percentage (often below 5 to 10 percent) alongside deep standing collection bids just below the floor price, ensuring you can exit a position without crashing the market.
Track Market Momentum and Ecosystem Rotation
Use macro dashboards to monitor capital flows between blockchains and sub-sectors, such as digital art, gaming assets, or membership passes. Identifying whether overall NFT liquidity is expanding or contracting helps investors adjust cash reserves and avoid deploying aggressive capital during broad market contractions.
Monitor Portfolio Performance and Exit Windows
Track your own wallet’s cost basis, unrealized gains, and collection-level holder churn continuously. When analytics reveal a sharp rise in active listings paired with declining unique holders and whale outflows, investors can proactively scale out of positions while bid-pool liquidity remains intact.
Risks and Limitations of NFT Analytics Platforms
While on-chain analytics brings unprecedented transparency to digital asset investing, treating any dashboard as an infallible crystal ball introduces dangerous blind spots. Understanding what blockchain data cannot show is just as important as knowing how to read the charts.
-
Incomplete Market Picture: On-chain metrics capture token transfers and smart contract interactions, but they cannot measure off-chain fundamentals such as team execution capability, intellectual property licensing deals, treasury runway, or genuine community sentiment.
-
Persistent Wash Trading Distortion: Even sophisticated algorithmic filters struggle to catch every form of market manipulation. Determined actors continuously evolve wash-trading techniques using fresh wallets, randomized time delays, and cross-marketplace routing to bypass automated detection.
-
Pseudonymous Wallet Ambiguity: A blockchain address is not a verified legal identity. A single investor or market maker can easily split holdings across dozens of unlinked wallets to simulate broad holder decentralization, while a single labeled whale wallet might actually represent a custodial vault or shared multisig.
-
Misleading Whale Movements: Blindly copying high-profile wallet purchases is a common retail trap. Whales frequently receive free tokens via promotional airdrops, execute over-the-counter swaps, transfer assets between personal cold storage vaults, or use public wallets as exit liquidity traps for followers.
-
Illusory Floor Prices: A high floor price does not guarantee that you can sell an asset at that valuation. In thin markets, an investor holding multiple items may find that selling just two or three tokens exhausts available bids, forcing subsequent sales at steep discounts.
-
Historical Bias: Past price resilience, strong historical volume, or consistent trait premiums provide zero guarantee of future demand. Rapid shifts in technology, metadata standards, or collector preferences can render previously dominant collections obsolete.
-
Methodological Discrepancies Across Platforms: Different analytics providers calculate floor prices, market capitalizations, and wash-trade exclusions using varying rules. One platform may include outlier trait listings or exclude specific marketplaces, leading to conflicting numbers that require cross-verification.
Final Thoughts
On-chain NFT analytics has transformed digital collectible investing from a game of guesswork into a discipline grounded in verifiable evidence. By looking directly at blockchain settlement records, investors can cut through speculative noise, verify authentic demand, evaluate liquidity depth, and understand how capital actually moves across collections and networks.
However, no single analytics platform offers a complete view of the market. Pure intelligence suites like Nansen excel at wallet attribution and Smart Money tracking, customizable engines like Dune unlock deep forensic queries, macro aggregators like CryptoSlam reveal multi-chain historical trends, and trading terminals like Blur expose real-time bid-pool liquidity. Combining complementary tools—pairing high-level market aggregators with wallet intelligence and marketplace order-book data—produces far more reliable research than relying on any isolated dashboard.
Ultimately, NFT analytics platforms are powerful decision-support instruments rather than automated profit guarantees. The strongest investment outcomes emerge when disciplined on-chain data analysis is paired with fundamental due diligence, strict risk management, and an honest recognition of market liquidity constraints.
Frequently Asked Questions About On-Chain NFT Analytics Platforms
What are the best free on-chain NFT analytics tools for beginners?
Investors starting out without a paid subscription budget can rely on Dune, CryptoSlam, and Blur for comprehensive free market research. Dune allows users to browse thousands of free, community-built dashboards covering collection retention and marketplace volume, while CryptoSlam offers free multi-chain rankings and historical sales records. For real-time floor price tracking and live bid-pool depth on Ethereum, Blur provides institutional-grade order book visibility at zero subscription cost.
How do investors track NFT whale wallets and smart money movements?
To monitor high-value collectors and profitable traders, investors use wallet intelligence platforms such as Nansen and NFTGo. These platforms label prominent blockchain addresses based on historical realized profits, portfolio size, and early minting success. By adding labeled Smart Money wallets to a custom watchlist or setting real-time alerts, investors can see when experienced buyers begin accumulating a collection before broader retail attention arrives.
How can you tell if an NFT collection has fake volume or wash trading?
Investors can detect artificial trading volume by cross-referencing total sales volume against unique buyer counts and checking wash-trade-adjusted leaderboards on platforms like NFTGo and CryptoSlam. If a collection reports high daily trading volume driven by only a small handful of wallets repeatedly buying and selling the exact same tokens—especially on zero-fee marketplaces—the activity is likely wash trading designed to manipulate rankings rather than organic investor demand.
What is the difference between an NFT marketplace and an on-chain analytics platform?
An NFT marketplace, such as OpenSea or Blur, is primarily designed to facilitate buying, selling, and bidding on digital assets, offering surface-level metrics like active listings and recent sales. In contrast, a dedicated on-chain analytics platform, such as Nansen or Dune, indexes raw smart contract logs across the broader blockchain to reveal deeper behavioral insights, including wallet profitability, holder concentration, cross-collection capital flows, and historical retention trends.
Which NFT analytics platform is best for tracking multiple blockchains?
CryptoSlam and Dune offer the broadest multi-chain coverage for investors tracking ecosystems beyond Ethereum. CryptoSlam aggregates standardized sales and buyer data across more than twenty networks—including Solana, Bitcoin Ordinals, Polygon, Mythos, and Flow—making it ideal for macro cross-chain comparisons. Dune similarly indexes raw smart contract data across major Layer 1 and Layer 2 blockchains, allowing analysts to compare ecosystem growth within custom dashboards.
How do you check NFT collection liquidity before buying?
Before purchasing an NFT, investors check two primary metrics on platforms like Blur or NFTGo: the listing-to-supply ratio and standing collection bid depth. A healthy, liquid collection typically has a low percentage of its total supply listed for sale alongside deep, active collection offers sitting close to the current floor price. If active bids are far below the floor price, selling an asset quickly will likely require accepting a steep discount.
Why do different NFT analytics platforms show different floor prices?
Discrepancies in floor prices occur because analytics platforms use different indexing speeds, marketplace integrations, and filtering rules. Some platforms update listings in sub-second intervals from every decentralized marketplace, while others refresh periodically or exclude specific peer-to-peer protocols and flagged suspicious items. Cross-checking floor prices directly against live marketplace order books ensures accurate valuation before executing a trade.