Best Cross-Chain NFT Analytics
Best Cross-Chain NFT Analytics | Track, Analyze & Optimize Your NFT Investments
The world of Non-Fungible Tokens (NFTs) is a digital frontier that has rapidly evolved from a niche concept into a multi-billion dollar ecosystem. With this meteoric rise in popularity—encompassing everything from digital art and collectibles to in-game assets and virtual real estate—comes a complex, multi-layered market that demands sophisticated tools for navigation. The days of NFTs existing solely on a single blockchain are over. The future of digital ownership is cross-chain, and to truly track, analyze, and optimize your investments, you need the right analytics that can keep pace.
This comprehensive guide will delve into the critical role of cross-chain NFT analytics, explore the top platforms leading this charge, detail the essential metrics every investor must track, and provide a roadmap for maximizing your portfolio in this interconnected digital landscape.
The NFT Boom and the Need for Cross-Chain Analytics
The NFT phenomenon has fundamentally redefined digital ownership. An NFT acts as a verifiable deed of ownership for a unique digital or physical asset, leveraging blockchain technology to ensure immutability and transparency. Initially, the market was dominated by a single ecosystem, namely Ethereum. However, the success of Ethereum’s NFT market quickly revealed limitations, primarily high gas fees and network congestion, which opened the door for alternative, faster, and cheaper blockchains.
The subsequent rise of other vibrant Layer-1 and Layer-2 ecosystems—including Solana, Polygon, Binance Smart Chain (BNB Chain), Avalanche, and many others—has transformed the NFT landscape from a single marketplace into a sprawling network of interconnected economies. This proliferation of chains, while beneficial for overall market growth and competition, has created a significant challenge for investors.
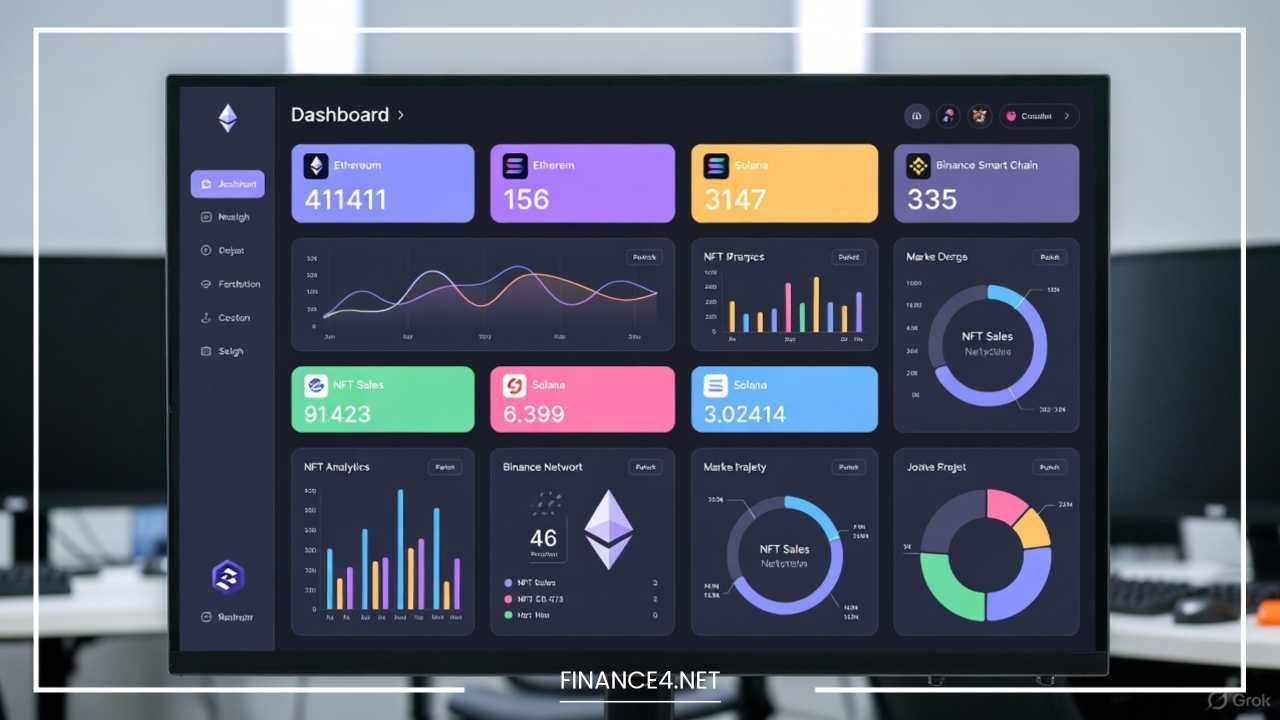
Assets and liquidity are now fragmented across these different ecosystems, making it nearly impossible to gain a comprehensive view of the market by looking at a single blockchain. This is where the necessity of cross-chain NFT analytics emerges. For investors, creators, and traders, cross-chain analytics are the essential lens required to cut through the fragmentation, see the entire market in one cohesive view, and make truly informed, profitable decisions.
Understanding NFTs and Cross-Chain Functionality
Defining Non-Fungible Tokens (NFTs)
At their core, NFTs are cryptographic assets on a blockchain, each with unique identifying codes and metadata that distinguish them from each other. Unlike fungible tokens (like Bitcoin or Ethereum, where one unit is identical and interchangeable with another), a non-fungible token is unique. This uniqueness allows them to represent distinct items like a specific piece of digital art, a rare collectible, or a land parcel in a metaverse. Key attributes include immutability, meaning the record of ownership cannot be changed, and verifiable ownership, where the history of the asset is transparently recorded on the public ledger.
The Crux of Cross-Chain Technology
Cross-chain technology refers to the infrastructure and protocols that enable different, independent blockchain networks to communicate and exchange data or assets securely. In the context of NFTs, cross-chain functionality allows an NFT originally minted on one blockchain (e.g., Ethereum) to be moved, traded, or utilized on another blockchain (e.g., Solana) using a process often facilitated by cross-chain bridges.
The primary reason cross-chain interoperability is crucial for NFTs is the need for greater liquidity and accessibility. A broader market means more potential buyers and sellers, which is vital for an asset’s health and value.
Challenges and Benefits:
-
Benefits: Increased market size, access to lower transaction fees on different chains, and the ability to leverage unique application strengths of various ecosystems (e.g., gaming on a fast chain, storage on a secure chain).
-
Challenges: The process of bridging an NFT can introduce complexity and security risks, particularly with the underlying bridge technology. Furthermore, tracking the “wrapped” or derivative versions of an NFT as it moves between chains can be technically difficult, which is a core problem that cross-chain analytics seeks to solve.
The Limitations of Traditional NFT Analytics
Before the rise of cross-chain platforms, NFT analytics tools were largely monolithic, meaning they were built to cover and analyze the data of a single blockchain, most commonly Ethereum. While excellent for their native chain, these traditional platforms now operate with significant blind spots that fundamentally skew an investor’s market view.
The Single-Chain Blind Spot
Imagine trying to assess the global art market by only observing sales in one city. This is the analogous problem with single-chain analytics. They are limited by the data silo of their native chain.
Traditional platforms often miss:
-
Cross-Chain Price Discrepancy: An NFT collection’s floor price on Ethereum might appear robust, but its bridged or parallel collection on a chain like Polygon or ImmutableX could have a significantly lower floor or higher trading volume. Traditional tools are blind to this overall market context.
-
Fragmented Liquidity: A collection’s liquidity is the total pool of buyers and sellers across all chains. A single-chain tool can only report on the small fraction of liquidity on its supported chain, giving a false sense of the asset’s true market depth.
-
Asset Migration Tracking: When a project launches a bridge, a substantial portion of its collection might migrate to a new chain to take advantage of lower fees or faster transactions. Traditional analytics will only report a sharp drop in on-chain activity on the original chain, failing to follow the asset’s activity to its new home.
-
Emerging Chain Opportunities: New, rapidly growing chains with explosive NFT markets, like Solana or newer Layer-2s, are often entirely invisible to platforms focused only on the older, established chains. This results in investors missing out on early-stage, high-growth opportunities.
The inability of traditional tools to see the full picture means investors are making decisions based on incomplete, and often misleading, data, leading to suboptimal portfolio management and missed opportunities.
How Cross-Chain NFT Analytics Can Improve Decision Making
Cross-chain NFT analytics tools are essential for transforming fragmented data into strategic intelligence. By aggregating and synthesizing data from multiple blockchains, these platforms offer investors a holistic, panoramic view of the entire NFT market, leading to vastly improved decision-making.
Gaining a Broader Market View
The primary benefit is the ability to move beyond a single-chain focus and understand macro-level market movements. An investor can instantly compare the overall health of the Ethereum NFT market versus the Solana NFT market, or track a specific collection’s total transaction volume regardless of which chain the trades occurred on. This prevents the costly mistake of over-investing in a single-chain fad while ignoring a sustainable, long-term trend elsewhere.
Specific Cross-Chain Metrics and Insights
Cross-chain platforms offer a suite of powerful, integrated metrics:
-
Aggregated Floor Price: The ability to see the lowest available price for a single collection across all supported chains. This is critical for assessing the true market floor and identifying arbitrage opportunities.
-
Total Volume (All Chains): An accurate representation of an NFT collection’s trading activity across every blockchain, providing the definitive measure of its market interest and momentum.
-
Chain-Specific Performance: Detailed reports on which chain is generating the most volume, which is attracting the most new users, and where the cheapest gas fees are, enabling investors to choose the optimal environment for trading.
-
Cross-Chain Whale Tracking: Following the activity of large, influential wallets not just on one chain, but as they move assets and funds between ecosystems. This provides early signals of major shifts in investor sentiment.
Assessing Risks and Rewards
Cross-chain data dramatically improves risk management. If a collection is seeing a massive drop in wallet activity on its native chain but an unexpected spike in bridging activity, the analytics platform can alert the investor to a chain migration, rather than a collapse in interest. Conversely, if a collection is losing volume across all chains, the risk is clearly systemic, prompting a timely exit. By seeing the complete flow of capital and assets, investors can more accurately weigh the potential risks and rewards of an NFT investment.
Top Cross-Chain NFT Analytics Platforms
The market for cross-chain NFT analytics is rapidly maturing, with several key players establishing themselves as indispensable tools for serious traders and investors. Each platform has its own strengths, supported chains, and unique feature sets.
1. Nansen
Nansen is renowned as a premier blockchain data analytics platform that offers advanced tools for both fungible tokens and NFTs. Its strength lies in its sophisticated on-chain data and “Smart Money” labels, which track the activity of high-value wallets and institutional investors.
-
Features: Smart Money tracking for NFTs, comprehensive collection dashboards with multi-chain data, wallet profiling, real-time alerts for market movements, and in-depth fundamental metrics.
-
Supported Chains: Strong coverage of Ethereum, Polygon, BNB Chain, Avalanche, and several other EVM-compatible networks. Coverage is continually expanding to include non-EVM chains.
-
Pros: Exceptional for following the actions of top-tier investors; high-quality, granular data; sophisticated filtering tools.
-
Cons: Subscription-based and can be expensive for casual users; the sheer depth of data can be overwhelming for beginners.
-
User Interface: Professional and data-dense, favored by experienced traders and institutional analysts.
2. DappRadar
Initially a tool for tracking decentralized applications (Dapps), DappRadar has evolved into a robust cross-chain analytics platform for NFTs, focusing heavily on market trends, overall blockchain performance, and gaming.
-
Features: Global NFT market cap and volume aggregation, rankings for collections across chains, Dapp-specific data (especially for NFT-driven games), and detailed blockchain performance comparisons (User Activity, Volume).
-
Supported Chains: Broad support including Ethereum, Solana, Polygon, BNB Chain, Wax, Flow, and more, making it one of the most chain-agnostic platforms.
-
Pros: Excellent for macro-level market analysis and comparative chain health; covers a vast number of blockchains; good free-tier option.
-
Cons: Less granular “whale” tracking compared to platforms like Nansen; NFT data is often summarized rather than deeply explored.
-
User Interface: Clean, intuitive, and highly accessible for both beginners and intermediate users focusing on overall market trends.
3. NFTGo
NFTGo positions itself as a comprehensive platform with a strong focus on data visualization, tracking whale movements, and NFT rarity. It has built a solid reputation for its ease of use and rich feature set.
-
Features: Real-time NFT market data, total market value visualization across major chains, large-scale whale tracking and portfolio monitoring, rarity ranking for individual assets, and heatmaps of market activity.
-
Supported Chains: Primary focus on Ethereum, with robust expansion into Solana, Polygon, and others, offering integrated views of the combined market.
-
Pros: User-friendly interface with exceptional data visualization; strong emphasis on rarity and whale behavior; helpful for portfolio management.
-
Cons: Cross-chain support is strong on the main EVM chains but can sometimes lag on newer, smaller ecosystems compared to DappRadar.
-
User Interface: Highly visual, colorful, and easy to digest, making complex data accessible to a wide audience.
4. Dune Analytics (Dune)
While not a traditional platform, Dune is an open-source data tool that allows users to query blockchain data using SQL and create custom, publicly shared dashboards. It has become a vital resource for community-driven cross-chain analysis.
-
Features: Unlimited customizability, community-created dashboards for specific collections or metrics, the ability to join data across multiple chains for bespoke analysis.
-
Supported Chains: Extremely comprehensive support for nearly all major and minor EVM-compatible chains (Ethereum, Polygon, Optimism, Arbitrum, etc.) and growing support for non-EVM chains like Solana.
-
Pros: The ultimate tool for custom, in-depth analysis; data is transparent and verifiable; completely free to use.
-
Cons: Requires SQL knowledge to create custom queries; relies on community members to build and maintain dashboards; not a “plug-and-play” solution.
-
User Interface: Technical and utilitarian, best suited for advanced users, developers, and analysts with a background in data science.
These platforms represent the current vanguard of NFT intelligence, offering the cross-chain context necessary for sophisticated investment strategies. The key difference often lies in the balance between granularity (Nansen/Dune) and broad-chain coverage/user-friendliness (DappRadar/NFTGo).
Key Metrics to Track When Using Cross-Chain NFT Analytics
To optimize an investment, one must move beyond simple floor price checks. Cross-chain analytics allows for the tracking of combined, contextual metrics that paint a true picture of an NFT’s health and market viability.
1. Floor Price: The True Lowest Bid
In a single-chain environment, the floor price is simple. In a cross-chain world, you must track the Aggregated Floor Price—the lowest price a specific NFT or collection is listed for across all active chains.
-
Significance: This metric is crucial for determining the asset’s true market valuation and is the first indicator of potential arbitrage. If the price on Ethereum is $5,000 and the wrapped version on Polygon is $4,000, the true floor is $4,000, and an arbitrage opportunity may exist. Cross-chain analytics provides this unified figure.
2. Market Volume: The Measure of Demand
Market volume reflects the total monetary value of transactions for a collection. Cross-chain analytics calculates Total Market Volume, ensuring that trades on every chain where the asset is active are included.
-
Interpretation: A high, consistent Total Market Volume indicates robust, chain-agnostic demand. A volume spike isolated to a single, low-cost chain (like Polygon) might signal a temporary rush driven by a promotional event rather than deep, sustainable investor interest. Investors should track volume trends across chains to identify where the real money is flowing.
3. Liquidity: The Ease of Entry/Exit
Liquidity is the market’s ability to facilitate quick and easy transactions without dramatically affecting the price. In the cross-chain world, liquidity is fragmented. Metrics to track include the Number of Active Listings Across All Chains and the Depth of the Bid/Ask Book.
-
Importance: High liquidity (a large number of listed NFTs and close proximity between the highest bid and lowest ask) across multiple chains means you can buy or sell without moving the price significantly. Poor liquidity, even if the floor price is high, can make an asset difficult to exit quickly.
4. Transaction History: A Full Audit Trail
Cross-chain transaction history provides a Unified Transaction Log, consolidating all historical sales and transfers, regardless of which blockchain they occurred on.
-
Significance: This data is essential for assessing an NFT’s past performance and investor behavior. By viewing the complete history, you can identify patterns like whale accumulation on a secondary chain before a major announcement, or a rapid, coordinated sell-off across multiple chains, signaling a market-wide loss of confidence.
5. Wallet Activity: Gauging Market Sentiment
Cross-Chain Wallet Activity tracks how many unique wallets are actively buying, selling, or holding a collection across all supported chains. This is a critical gauge of market sentiment and popularity.
-
Interpretation: A growing number of active wallets across diverse chains suggests a healthy, expanding community and broadening adoption. The platform’s ability to label and track Cross-Chain Smart Money wallets offers invaluable insight into where professional investors are deploying capital and accumulating assets.
How to Optimize Your NFT Investment Strategy with Cross-Chain Data
Leveraging cross-chain analytics is not just about tracking; it’s about active strategy optimization in a multi-chain world.
Diversifying Across Chains for Risk Mitigation
Cross-chain analytics provides the data to intelligently diversify your portfolio beyond Ethereum. By monitoring chain-specific health, you can allocate capital to high-growth, lower-fee chains (like Solana for gaming assets or Polygon for utility NFTs) without abandoning the security and liquidity of established networks like Ethereum.
-
Optimization: Use the analytics to identify the risk-adjusted return of a chain. A newer chain might offer 10x potential returns but has 5x the volatility of Ethereum. Diversification based on this risk profile minimizes single-chain exposure.
Identifying Emerging Chains and Trends
The next major NFT boom may not happen on a legacy chain. By tracking metrics like New Wallet Creation Rate and Total Volume Growth % across dozens of blockchains, cross-chain analytics platforms can spot a new, emerging ecosystem before it becomes mainstream.
-
Optimization: Look for a sustained increase in Unique Active Wallets (UAW) on a new chain combined with a gradual rise in Total Value Locked (TVL). This is a strong, early signal of organic growth and a potential early-entry opportunity.
Risk Management through Correlation Analysis
Cross-chain data allows for a correlation analysis between asset prices on different chains. If two collections on two different chains consistently move in tandem, they may be linked by the same investor demographic or market trend.
-
Optimization: If the price of one asset drops sharply, immediately check the performance of its correlated assets on other chains. If the drop is isolated, it might be a specific liquidity issue. If the drop is correlated across chains, the systemic risk is higher, signaling an urgent need for re-evaluation.
Liquidity and Arbitrage Opportunities
The most direct strategic advantage of cross-chain analytics is the ability to spot arbitrage opportunities. These occur when the price of the same or a very similar asset (e.g., a native NFT on Ethereum and its wrapped version on a sidechain) is different on two separate marketplaces.
-
Optimization: The platform will flag collections with a significant price disparity between chains. A trader can quickly buy the cheaper asset on one chain, move it across the bridge (accounting for bridging fees and time), and sell it for a profit on the chain with the higher price. For sellers, cross-chain data helps identify the marketplace with the deepest liquidity and highest immediate buyer interest, ensuring a faster, more optimal sale price.
Challenges of Cross-Chain NFT Analytics
Despite their immense value, cross-chain analytics platforms face significant technical hurdles in achieving perfect data consistency and security. Understanding these challenges is key to interpreting the data responsibly.
Data Fragmentation and Standardization
The fundamental difficulty lies in the fact that every blockchain uses a different structure, programming language, and data format. Aggregating data from disparate systems—like combining a sale from a Solidity-based Ethereum contract with a sale from a Rust-based Solana program—is a massive undertaking.
-
The Problem: Data Fragmentation makes it difficult to ensure accurate and consistent data across all chains. A “floor price” metric may be calculated differently based on how each platform indexes sales data on its native chain.
-
The Solution: Platforms are constantly investing in data engineering to create standardized schemas that translate all on-chain activity into a unified, comparable format.
Interoperability Issues and Tracking Accuracy
The process of moving an NFT between chains—often involving “wrapping” or “locking” the original asset on one chain to mint a derivative on the destination chain—is a core challenge for tracking.
-
The Problem: If a cross-chain bridge is flawed or the transfer is delayed, the analytics platform must correctly identify and track the asset’s current location and status without counting it as two separate, active NFTs.
-
The Solution: The best platforms integrate directly with the APIs of the major cross-chain bridge protocols (like Wormhole, LayerZero, or native bridges like Polygon’s) to receive real-time, verified updates on the status of bridged assets.
Security Risks of the Underlying Infrastructure
While the analytics platform itself may be secure, the data it reports is only as safe as the underlying multi-chain infrastructure.
-
The Problem: Cross-chain bridges have been major targets for hackers due to the vast amounts of locked assets they secure. If a bridge is exploited, the value of the “wrapped” assets on the destination chain can collapse, and the analytics need to reflect this immediately.
-
The Solution: Platforms prioritize data from bridges with strong security audits, large economic security guarantees, and decentralized governance models, and they often include risk flags or security warnings alongside their data feeds.
Scalability
The number of NFT collections, unique wallets, and new blockchain networks is growing exponentially.
-
The Problem: The volume of data to index, process, and query grows with every new chain and every new NFT mint. This places immense pressure on the analytics platforms’ backend infrastructure, threatening data latency and accuracy.
-
The Solution: Utilizing advanced, distributed data storage and indexing solutions—including specialized graph databases—to ensure that data remains near real-time, even as the scale of the Web3 ecosystem continues its relentless expansion.
Future of Cross-Chain NFT Analytics and the NFT Market
The future of the NFT market is inextricably linked to the advancement of cross-chain interoperability and the analytics tools that track it.
The Interoperability Evolution
The next generation of the blockchain is moving beyond simple bridges to more seamless, native interoperability solutions. Projects like Polkadot (via XCM) and Cosmos (via IBC) are building ecosystems where communication and asset transfer are built into the network’s core architecture, eliminating the need for many of the external, custodial bridges that exist today. Universal messaging protocols like Chainlink CCIP and LayerZero are also enabling smart contracts to communicate across chains without an asset physically moving, ushering in an era of omnichain applications.
Evolution of Analytics Platforms
Cross-chain NFT analytics will evolve to become even more predictive and integrated:
-
AI Integration: Artificial intelligence and machine learning will be deployed to sift through the petabytes of cross-chain data, not just reporting on the present but predicting the likelihood of a chain migration, a price flash crash, or a collection’s next 10x move.
-
Seamless Interoperability Tracking: As bridges become more native and invisible to the user, analytics will follow suit, making the chain where an NFT resides an irrelevant detail, focusing instead on its total performance across the entire digital ecosystem.
-
Regulatory Adaptation: As governments create clearer regulatory frameworks for digital assets, analytics platforms will adapt, potentially offering compliant data feeds that allow institutional investors to confidently enter the multi-chain NFT space.
The Impact on the NFT Market
The continued improvement of cross-chain analytics will solidify the market. By providing clearer, less fragmented data, it will reduce informational asymmetry, make the market more efficient, and attract larger, more sophisticated capital pools. The result will be a more mature, stable, and truly global market for Non-Fungible Tokens.
Final Thoughts: Maximize Your NFT Investments with Cross-Chain Insights
The NFT market is not a single entity; it is a sprawling, multi-ecosystem financial frontier. Trying to manage your investments with single-chain data is like driving a race car with blinders on—you will inevitably miss critical market signals and opportunities.
Cross-chain NFT analytics are no longer a luxury for the professional trader; they are a necessity for any investor seeking a comprehensive, risk-aware, and profitable portfolio. By utilizing platforms like Nansen, DappRadar, and NFTGo, you gain the power to track total market volume, identify true aggregated floor prices, and follow the flow of capital as it moves across Ethereum, Solana, Polygon, and beyond.
To maximize your NFT investments, you must embrace the reality of a cross-chain world. Incorporate these sophisticated insights into your daily strategy to track, analyze, and ultimately optimize your returns in the most dynamic market the financial world has ever seen. The insights are there—it is now up to you to leverage them.
: What It Means and How It Works")


