How to Combine NFT Analytics with DeFi Data
 by
by 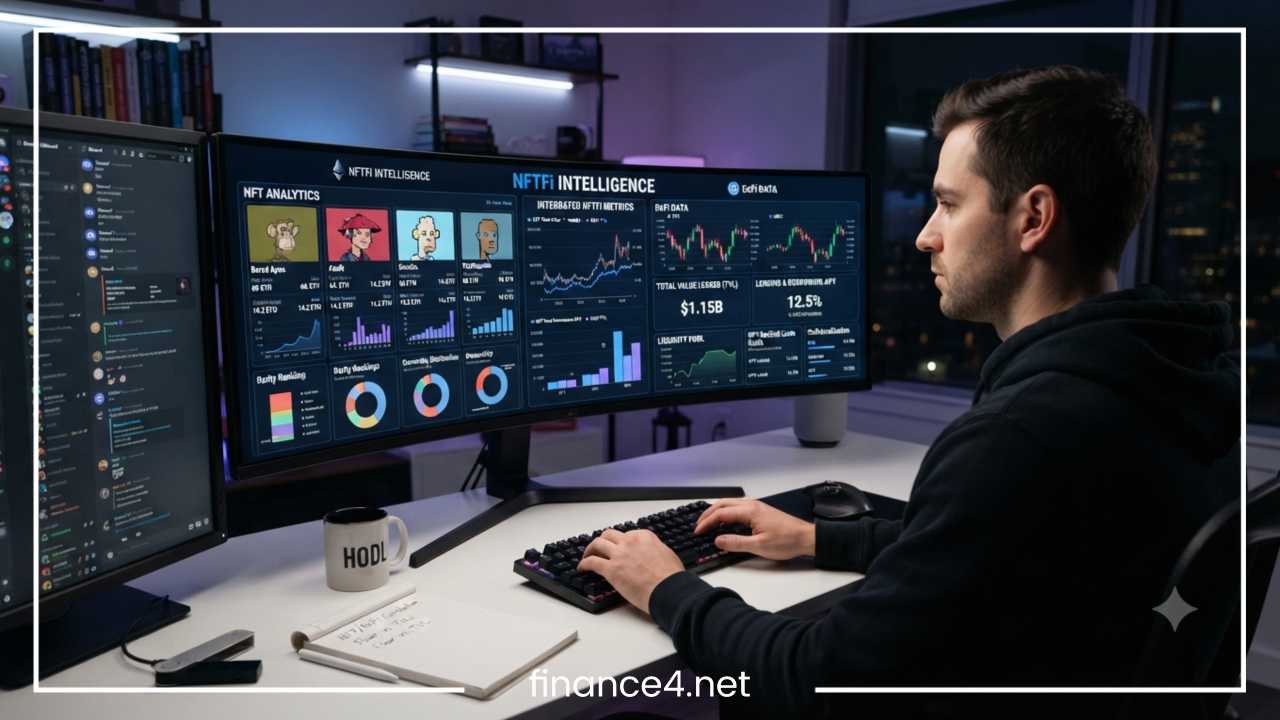
How to Combine NFT Analytics with DeFi Data | Complete Guide
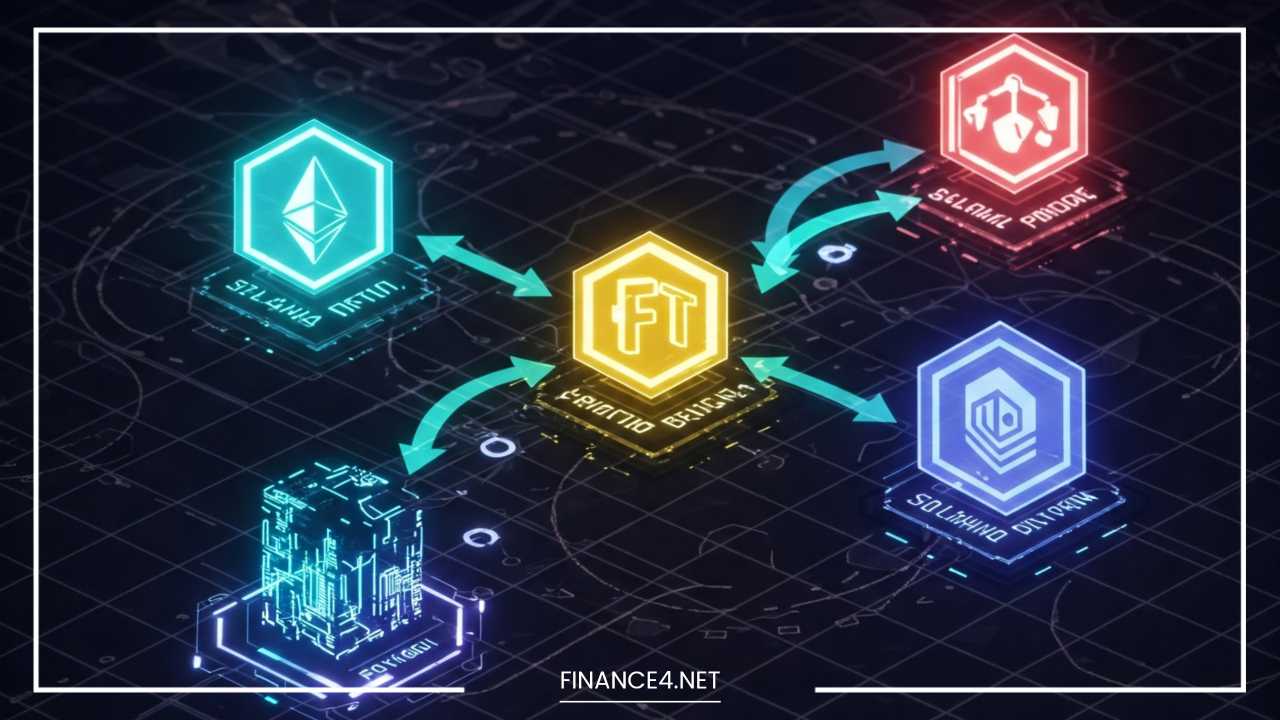
The blockchain ecosystem is undergoing a massive convergence. In the early stages of decentralized networks, non-fungible tokens (NFTs) and decentralized finance (DeFi) existed as largely distinct silos. NFTs were primarily celebrated for digital art, collectibles, and cultural expressions, while DeFi established the infrastructure for permissionless trading, lending, and yield generation. Today, that boundary has dissolved. The financialization of NFTs has bridged these two ecosystems, turning digital assets into sophisticated financial instruments.
Modern Web3 market activity frequently merges both worlds. Advanced participants no longer simply buy and hold a digital collectible; instead, they interact with an intricate web of decentralized financial protocols built on top of unique assets. This intersection manifests in several prominent trends:
-
NFT-backed lending: Using digital collectibles as collateral to secure liquid cryptocurrency loans.
-
Fractional ownership: Breaking high-value NFTs into fungible ERC-20 tokens to democratize access and bootstrap liquidity.
-
Yield strategies: Staking NFTs or locking them into liquidity vaults to earn continuous protocol rewards.
-
Marketplace liquidity analysis: Examining order books, bidding pools, and automated market maker depth across decentralized exchanges.
-
Wallet-based investment tracking: Assessing macro portfolio health by looking at combined digital art assets and fungible token balances simultaneously.
Analyzing either market in isolation creates a dangerous blind spot. An investor looking only at NFT floor prices misses the underlying liquidity mechanics driving the market, while a DeFi strategist ignoring NFT collateral risks miscalculating systemic smart contract vulnerabilities. Combining NFT analytics with DeFi data provides a comprehensive, unified view of Web3 markets. This complete guide outlines the principles, methodologies, data sources, and technical frameworks required to unify these distinct data streams into a single, actionable analytical architecture.
Understanding NFT Analytics and DeFi Data
To successfully synthesize these data layers, it is essential first to understand the specific metrics, behavioral patterns, and variables native to each ecosystem.
What Is NFT Analytics?
NFT analytics focuses on tracking, measuring, and interpreting metadata and on-chain events associated with unique digital assets. Because NFTs represent non-fungible properties governed by token standards like ERC-721 or ERC-1155, their data footprint behaves differently than standard fungible tokens.
Key data points monitored within NFT analytics include:
-
Floor price movements: The lowest listed price for an item within a specific collection, serving as the baseline entry cost.
-
Sales volume: The total cumulative value traded over a specified period, indicating market liquidity and demand depth.
-
Holder distribution: The ratio of unique wallet addresses to the total supply of the collection, indicating whether ownership is decentralized or concentrated.
-
Wallet activity: On-chain tracking of individual buyer and seller behaviors, including minting activity, listings, and cancellations.
-
Trading frequency: The velocity at which tokens change hands within a collection, establishing velocity profiles.
-
Rarity analysis: The mathematical distribution of traits across a collection, which establishes the premium pricing models for specific individual tokens.
-
Marketplace performance: The market share and fee structures of specific distribution platforms like OpenSea, Blur, and Magic Eden.
-
Collection-level metrics: Historical aggregates that reveal long-term growth trajectories, community stickiness, and social sentiment signals.
By extracting and structuring these variables, data analysts can derive critical market insights. For instance, evaluating holder distribution alongside wallet activity helps identify rising collections before they reach mainstream momentum. Tracking wallet histories allows analysts to monitor whale accumulation patterns, noting when highly capitalized accounts silently sweep floor assets. Furthermore, isolating repetitive buy-and-sell loops between identical wallets provides a mechanism for detecting wash trading patterns, protecting investors from manipulated volume signals.
What Is DeFi Data?
DeFi data centers on the financial activities occurring within decentralized protocols governing fungible assets (such as ERC-20 tokens). This data is highly quantitative, transactional, and continuous, reflecting time-weighted financial performance and capital efficiency.
Key data components of the DeFi ecosystem include:
-
Total Value Locked (TVL): The aggregate value of all crypto assets deposited, staked, or locked within a smart contract or entire protocol, reflecting total user trust and capital commitment.
-
Liquidity pools: The balance ratios and depth of automated market maker (AMM) smart contracts, which dictate price slippage and trading capacity.
-
Token prices: Spot and time-weighted average prices (TWAP) across decentralized and centralized venues.
-
Lending activity: The volume of capital placed into lending pools to earn interest.
-
Borrowing rates: The dynamic utilization-based interest rates paid by borrowers to access capital.
-
Yield farming data: The annual percentage yields (APY) and incentive distributions offered to liquidity providers.
-
Decentralized exchange activity: Metrics covering daily trading volume, fee generation, gas consumption, and individual trader routing patterns.
DeFi data acts as the macroeconomic barometer for the broader crypto ecosystem. It reflects real-time risk tolerances, leverage demand, capital velocity, and liquidity allocations. While NFT analytics tracks asset sentiment and cultural capital, DeFi data documents the underlying monetary mechanics, funding costs, and financial behavior driving the Web3 landscape.
Why Combine NFT Analytics With DeFi Data?
Relying exclusively on standalone NFT analytics exposes analysts to significant information asymmetries. NFT markets do not operate in a vacuum. A sudden collapse in a collection’s floor price might appear inexplicable when viewing collection-level charts, yet a simultaneous check of DeFi data might reveal a massive liquidation cascade on an NFT lending platform. Combining these datasets unlocks several structural advantages for market participants.
Better Market Understanding
NFT assets are highly sensitive to broader macroeconomic liquidity conditions within the cryptocurrency market. When DeFi yields are exceptionally high, capital often flows out of illiquid assets like NFTs and back into yield-bearing DeFi pools. Conversely, when DeFi interest rates drop, investors seek higher risk profiles, injecting capital into the NFT market.
By superimposing DeFi metrics such as stablecoin velocity, decentralized exchange volumes, and protocol utilization rates onto NFT sales trends, analysts can determine whether an NFT bull run is supported by authentic, inbound capital or if it is merely speculative churn among existing participants. This approach directly helps determine the price sustainability of digital asset ecosystems.
Portfolio Risk Analysis
A truly accurate investor profile cannot be constructed by evaluating assets in isolation. Sophisticated Web3 market participants hold multi-layered positions that cross boundaries hourly. An investor may hold premium NFTs, maintain stablecoin balances on decentralized exchanges, borrow capital against their digital art collection on a peer-to-peer lending protocol, and stake the borrowed funds into an external DeFi yield farm.
Evaluating an active web3 profile requires a simultaneous look at four distinct vectors: digital art assets valued at current collection floor levels, liquid fungible token balances across multiple standard wallet networks, active debt positions maintained inside major decentralized lending pools, and secondary yield or market-making exposures locked within automated market makers. Unifying these datasets allows portfolio management platforms and risk managers to calculate net asset values (NAV) accurately, evaluate real-time health factors, monitor liquidation thresholds, and measure holistic market exposure across volatile asset classes.
Identifying New Opportunities
The synthesis of NFT and financial data highlights structural market inefficiencies that can be exploited for profit. For example, by identifying NFT collections experiencing a sharp rise in borrowing activity on protocols like Blend or NFTfi, an analyst can anticipate future buying pressure or imminent liquidation events.
Similarly, observing that major DeFi whales are rotating their yield farm profits directly into specific NFT projects can serve as an early indicator of institutional or high-net-worth sentiment shifts. Unifying these data streams enables market participants to build predictive models that identify macro-level arbitrage opportunities, collateral mispricings, and early-stage capital rotation cycles before they become common knowledge.
Key NFT Data Points to Integrate With DeFi Metrics
To build an integrated analytics framework, developers must understand how individual data points from each ecosystem map to one another. The following matrix illustrates how pairing specific NFT metrics with corresponding DeFi data variables generates integrated market insights.
| NFT Analytics Data | DeFi Data | Combined Insight |
| Floor price trends | Token liquidity depth | Price sustainability and market capitalization health |
| Trading volume | DEX transaction volume | Holistic ecosystem market demand and capital velocity |
| Holder growth rates | Wallet balance distribution | Capital movement trends and wealth concentration |
| NFT collateral activity | Lending pool utilization | Borrowing behavior, leverage health, and liquidation risks |
| Whale purchases | DeFi yield positions | Comprehensive institutional investor strategy and asset rotation |
NFT Metrics
When constructing data models, specific foundational NFT metrics require precise extraction from on-chain event logs:
-
Floor price trends: Calculated by querying active marketplace listings and filtering out outlying bids to isolate the lowest current executable price.
-
Sales volume: Aggregated across multiple marketplaces (including aggregators) to determine total transactional liquidity over time.
-
Unique buyers/sellers: Tracked via wallet addresses to determine the growth or contraction of the active user base.
-
Holder concentration: Calculated using statistical concentration models or top wallet percentages to evaluate centralization risk.
-
Marketplace activity: Monitoring contract-level calls to understand where trading fee distribution and order execution are concentrating.
-
Royalty activity: Tracking secondary marketplace enforcement rates to forecast ongoing creator revenue sustainability.
DeFi Metrics
These NFT metrics must be paired with operational DeFi telemetry gathered directly from smart contract states:
-
Total Value Locked (TVL): The net underlying capital locked in smart contracts, acting as an anchor for platform reliability.
-
Liquidity depth: The amount of capital available within specific trading pairs, determining how easily assets can be swapped without causing extreme price deviations.
-
Token circulation: The ratio of liquid, circulating tokens to total supply, determining systemic dilution risks.
-
Borrowing/lending rates: The dynamic equilibrium costs of capital within cross-margin and isolated lending markets.
-
Protocol revenue: The actual fees collected by smart contracts, signaling economic utility and fundamental value.
-
User growth: Active daily unique interactions with protocol smart contracts, establishing network effect metrics.
NFT and DeFi Data Sources
To execute this integration, data pipelines must extract raw and semi-structured data from specialized infrastructure providers operating across both domains.
NFT Analytics Platforms
Extracting clean NFT data requires utilizing platforms capable of parsing unique token metadata, trait distributions, and decentralized marketplace contracts:
-
Dune Analytics: A powerful community-driven platform allowing analysts to write custom SQL queries against raw blockchain tables. Dune simplifies the process of tracking marketplace smart contracts, mint records, and individual token transfers across multiple networks.
-
Nansen: An analytics platform renowned for its wallet-labeling engine. Nansen allows users to track smart money movements, monitor whale accumulation patterns, and see where high-net-worth accounts are shifting capital within the NFT ecosystem.
-
CryptoSlam: A dedicated NFT data aggregator focusing on cross-chain historical sales data, volume tracking, and collection rankings across a wide variety of networks.
-
OpenSea API: Direct developer infrastructure providing real-time data regarding listings, offers, historic events, and collection traits directly from high-volume marketplace transactions.
These platforms excel at collection tracking, individual wallet profiling, and general marketplace macro data aggregation.
DeFi Data Sources
Conversely, monitoring the financial performance of underlying fungible assets requires tapping into infrastructure optimized for continuous asset pricing and pool tracking:
-
DefiLlama: The industry standard for tracking protocol-level TVL, yield farm APYs, token volumes, liquidations, and cross-chain capital flows. It provides a clean API for extracting historical protocol performance metrics.
-
Blockchain explorers: The ultimate source of truth for raw transaction tracking, verified contract code verification, and manual address inspection across major public ledgers.
-
DEX analytics platforms: These tools deliver real-time pricing feeds, pool reserve balances, transaction histories, and liquidity health updates for automated market makers.
-
Protocol dashboards: Native user interfaces and analytics engines provided directly by core protocols detailing specific internal risk states.
To interface with these sources, engineers rely heavily on REST and GraphQL APIs, custom web dashboards, and blockchain indexing services like The Graph, which abstract raw block data into highly performant, queryable data schemas.
How NFT Analytics and DeFi Data Are Connected
The conceptual bridge between these two spaces rests upon how data is written to and organized on public ledgers. There are three primary connection points where these data sets converge.
Wallet-Level Analysis
The most direct way to combine NFT analytics with DeFi data is at the wallet level. On public blockchains, a single cryptographic address serves as an identity container for all types of digital assets. By querying an individual wallet address, an integration engine can simultaneously extract its complete asset profile.
For example, an analysis of a single high-net-worth user account can show its concurrent positions across fields: holding multiple rare assets from a top-tier digital art collection, keeping substantial liquidity in decentralized stablecoin accounts, maintaining a heavily utilized debt position inside an automated money market, and providing liquidity directly to decentralized exchange pools. This single-point connection reveals exactly how digital assets are supported or threatened by debt.
Smart Contract Data
At a deeper layer, connectivity occurs through direct smart contract interactions. When a user deposits an NFT into a lending pool to borrow capital, the transaction generates an on-chain event log. This event links the NFT contract address and specific token ID directly to the DeFi lending pool contract address.
By parsing these multi-contract logs, analysts can read raw transaction histories and watch event logs to see how changes in a DeFi protocol’s interest rates directly spark changes in listing behaviors across secondary markets.
Blockchain Indexing
Raw blockchain data is inherently unstructured and challenging to query efficiently. To make sense of it, teams leverage blockchain indexing middleware. Services like The Graph use custom indexing programs called subgraphs to listen for specific smart contract events, parse the associated payloads, and store them in structured relational databases.
By building custom subgraphs that index both NFT marketplace events (like sales and listings) and DeFi pool events (like swaps and liquidity provisions) within the same data store, engineers can run unified GraphQL queries that yield instantaneous insights across previously separated ecosystems.
Step-by-Step Process to Combine NFT and DeFi Data
Building an integrated data pipeline requires an orderly, systematic workflow to move from raw data capture to synthesized actionable models.
Step 1: Define Your Objective
Before writing code, establish your specific analytic objective. Clear goals prevent data overload and dictate your technical approach. Common enterprise objectives include:
-
Finding undervalued NFT collections: Assessing collections whose floor prices haven’t reacted to a recent surge in native ecosystem token liquidity.
-
Monitoring NFT-backed lending platforms: Tracking health factors and systemic liquidation risks for collections used as collateral across peer-to-peer protocols.
-
Analyzing whale behavior: Setting up programmatic triggers that alert your team when institutional addresses shift funds from DeFi positions into digital art collections.
-
Building investment dashboards: Constructing unified internal portfolio views that calculate total risk-adjusted exposure across all on-chain asset types.
Step 2: Collect NFT Data
Once the objective is established, initiate your data collection stream for target collections. Query historic and real-time endpoints to capture floor price fluctuations, marketplace transaction volumes, token transfers, mint rates, listing densities, and historical wallet distribution paths. Ensure this data includes exact transaction hashes and block heights for future synchronization.
Step 3: Collect DeFi Data
Simultaneously, establish parallel collection feeds for the corresponding DeFi variables. Capture the total value locked within associated protocols, specific token liquidity depth metrics within stablecoin pools, historical lending/borrowing utilization patterns, and real-time asset spot prices. This phase ensures you capture the broader financial liquidity environment surrounding your target NFTs.
Step 4: Normalize the Data
Data normalization is the most critical technical step in the pipeline. Raw blockchain data is notoriously messy and inconsistent across different chains and environments. To combine these sets effectively, execute three normalization processes:
-
Cross-chain mapping: Standardize address strings, decimal places, and function call formats, particularly when aggregating data across distinct execution layers or non-EVM chains.
-
Wallet address mapping: Ensure that a single entity using multiple addresses across protocols is accurately mapped to a unified entity profile.
-
Timestamp alignment: Convert varied block-production intervals into standardized UTC time blocks so that an NFT sale can be paired precisely with the exact liquidity conditions present at that second.
Step 5: Create Combined Analytics Models
With normalized data in place, you can build composite scoring models that reveal deeper insights.
NFT Liquidity Score
This metric evaluates how easily an NFT asset can be converted back into liquid capital without suffering extreme value degradation. Calculate this by combining collection trading volume, unique holder counts, and marketplace bidding depth, then weight it against the real-time pool depth of the ecosystem’s native gas asset.
DeFi Exposure Score
This profile determines how heavily exposed a collection’s ecosystem is to financial leverage or systemic protocol risk. Calculate this by taking total token holdings, active lending collateral ratios, and liquidity deposit values across DeFi systems, mapping out how reliant an asset class is on debt stability.
Investor Behavior Analysis
A behavioral tracking model that categorizes wallets based on their combined actions. By tracking when a wallet purchases premium NFTs while simultaneously drawing down stablecoin debt or liquidating yield-bearing positions, you can build behavioral archetypes to predict broader market cycles.
Step 6: Visualizing Integrated Metrics
The final step is translating raw data matrix computations into accessible visual mediums. Construct clean, low-latency business intelligence interfaces using specialized enterprise software. Implement unified metrics charts showing floor prices layered over liquidity lines, configure automated system alerts for whale liquidations, and generate scheduled reporting models that highlight emerging opportunities and systemic vulnerabilities before they impact your capital positions.
Real-World Use Cases of NFT + DeFi Analytics
The practical application of this unified methodology yields substantial competitive advantages across several core market verticals.
NFT Lending Analysis
NFT lending protocols allow users to access liquidity without selling their digital assets. However, if the floor price of a collection drops below a specific liquidation threshold, the asset is automatically auctioned off to protect the lender.
By combining NFT analytics with DeFi data, risk managers can accurately predict systemic liquidation cascades. If a large whale holds numerous assets on a lending platform and is close to their liquidation margin, a minor drop in floor price could trigger a wave of automated listings, driving down prices for the entire collection.
Portfolio Management
For asset managers and individual investors, unified data enables comprehensive net asset value tracking. Instead of jumping between individual portfolio trackers and DeFi dashboards, an integrated system handles everything in one place. It calculates total capital efficiency by analyzing digital art valuations alongside native token exposure and current farming yields. This integration allows users to run automated stress tests to see how a sudden market drop would impact their overall portfolio health.
Whale Tracking
High-net-worth investors frequently front-run major market shifts. By tracking these whales across both NFT marketplaces and DeFi protocols, analysts gain a complete view of their capital rotation strategies.
For instance, an alert might show a known venture fund withdrawing substantial funds from a yield-bearing contract, swapping those tokens for Ethereum, and immediately executing sweeping floor purchases across a premium NFT collection. Observing this sequence provides a clear signal of high-conviction sentiment shift that isolated tracking would fail to contextualize.
Market Prediction
Combining these data streams unlocks advanced predictive modeling capabilities. By observing changes in regional token liquidity and decentralized exchange trading volumes, analysts can treat these financial movements as leading indicators for the digital art markets.
A surge in capital flowing into a specific network’s financial protocols often precedes an increase in volume for that network’s native NFT collections. Tracking these capital inflows allows traders to position themselves early in promising collections before consumer-facing demand surges.
Gaming and Metaverse Analytics
The gaming and virtual asset sectors rely on complex internal token economies. In-game items, virtual land plots, and character assets are represented as NFTs, while the internal currency operates as a fungible token traded on decentralized exchanges.
Analyzing an ecosystem using only asset metrics or only token metrics provides an incomplete picture. Evaluating the economic viability of virtual worlds requires an analytical lens that bridges both sides: tracking player purchases of property assets alongside the deep liquidity indicators of the game’s native trading tokens. Combining both data layers allows developers and investors to monitor the health of the entire game economy, revealing whether token inflation is diluting asset values.
Tools and Technologies for NFT + DeFi Analytics
Building an institutional-grade analytical infrastructure requires selecting a robust stack of underlying technologies designed to process high-throughput ledger data.
Data Collection Tools
The foundation of the stack relies on reliable data ingestion mechanisms:
-
Blockchain APIs: Infrastructure services provide scalable remote procedure call nodes to extract raw logs and state changes directly from blockchain networks.
-
Indexing platforms: Subgraph development frameworks decouple extraction logic from visualization layers, allowing for highly optimized querying environments.
-
Smart contract data providers: Enterprise data networks deliver normalized, institutional-grade pricing and transaction feeds for on-chain assets.
Analytics Tools
Once ingested, the processing and modeling phases require powerful computation and visualization suites:
-
SQL dashboards: Utilizing enterprise query environments to perform fast, collaborative query construction against pre-indexed data tables.
-
Python-based analytics: Leveraging customized scripts to interact with contracts, manipulate data frames, and execute complex statistical computations on unified datasets.
-
Visualization suites: Integrating enterprise business intelligence tools to build low-latency, real-time analytics monitoring dashboards.
AI and Machine Learning Applications
Integrating artificial intelligence transforms static dashboards into dynamic, predictive intelligence layers. Machine learning algorithms can be trained on unified historical datasets to automate complex analytical processes:
-
Price prediction models: Training regression models on combined historical floor movements and DeFi token volatility curves to estimate near-term asset values.
-
Fraud detection engines: Deploying anomaly detection algorithms that scan combined wallet histories to flag wash trading patterns, asset manipulation schemes, and smart contract exploits.
-
Wallet behavior classification: Utilizing statistical clustering techniques to categorize wallets into functional archetypes—such as yield farmers, collector whales, or high-frequency arbitrageurs—based on their transaction histories.
-
Market trend forecasting: Using predictive neural networks to process multi-variable data feeds, helping analysts anticipate broader sentiment shifts and macro capital rotation cycles.
Challenges When Combining NFT and DeFi Data
Despite the clear benefits of combining these data streams, analysts face several structural and technical hurdles during implementation.
Data Fragmentation
The web3 ecosystem spans dozens of alternative layers, optimistic rollups, and zero-knowledge scaling solutions. Each network runs its own distinct virtual machines, marketplace smart contracts, and decentralized exchange architectures. Aggregating data across these fragmented networks requires building custom integration adapters for each environment, creating ongoing maintenance overhead as protocols upgrade their smart contracts.
Data Accuracy
Ensuring data integrity remains an ongoing battle due to the open, permissionless nature of public blockchains. Wash trading, where a single entity buys and sells an asset between self-controlled wallets to create the illusion of high market demand, frequently inflates raw NFT volume statistics. Failing to identify and filter out these manipulated transactions leads to inaccurate data models and distorted pricing signals.
Valuation Challenges
Fungible tokens benefit from continuous, high-volume trading that provides clear, real-time spot pricing. NFTs, by contrast, are inherently illiquid and change hands warmth-free. Determining the accurate value of a rare asset within a collection is difficult. When these illiquid assets are used as collateral in DeFi lending protocols, pricing inaccuracies can lead to delayed liquidations or sudden systemic bad debt within the platform.
Privacy and Wallet Attribution
While on-chain transactions are completely public, mapping those addresses to specific real-world entities is a complex task. Advanced traders frequently rotate funds across separate burner wallets or utilize privacy-preserving protocols to obscure their trading tracks. This lack of clear wallet attribution limits an analyst’s ability to build definitive, comprehensive entity profiles, often leaving data models reliant on probabilistic assumptions rather than certainties.
Future of NFT and DeFi Analytics
As the ecosystem matures, the integration of NFT analytics and DeFi data will transition from a niche advantage to an industry standard. This evolution is driven by several emerging structural trends.
The financialization of unique tokens is accelerating through the growth of asset derivatives, options markets, and perpetual trading platforms. These complex financial products require highly accurate, low-latency data feeds that successfully combine asset-specific trait data with real-time liquidity pricing.
Concurrently, the rise of real-world asset (RWA) tokenization is bringing tangible properties—such as real estate, fine art, and private debt instruments—on-chain as unique digital tokens. Managing these tokenized real-world assets requires sophisticated analytics frameworks that can evaluate the underlying physical property data alongside standard DeFi liquidity, legal frameworks, and yield metrics.
As institutional capital enters the digital asset ecosystem, demand for institutional-grade compliance, risk management, and analytics platforms will rise. The platforms that succeed in this environment will be those that move past fragmented, siloed data frameworks. Instead, they will offer unified intelligence engines capable of parsing the entire blockchain landscape as a single, interconnected financial system.
Final Thoughts
The convergence of non-fungible tokens and decentralized finance marks a major evolutionary milestone for blockchain networks. The days of analyzing digital collectibles and fungible financial protocols in separate vacuums are gone. Today, understanding market movements requires a unified approach that tracks capital as it flows fluidly across asset classes.
By building integrated analytics frameworks that combine NFT metrics with DeFi telemetry, market participants gain a clearer view of market dynamics. This combined approach allows teams to build more accurate risk management profiles, discover hidden market opportunities, and protect capital from sudden liquidity shocks.
While challenges like data fragmentation and valuation complexities remain, the tools, indexing protocols, and data normalization strategies available today allow organizations to build resilient, highly predictive intelligence layers. As the lines between digital assets and decentralized finance continue to blur, implementing a unified data strategy is a fundamental requirement for navigating the future of global web3 markets.
Frequently Asked Questions
How do you calculate liquidation risk in NFT lending protocols using DeFi data?
To accurately calculate liquidation risk for NFT-collateralized loans, analysts must monitor the health factor of a loan by tracking the real-time floor price of the collection alongside the dynamic borrowing interest rates of the lending pool. By integrating a collection’s floor price volatility data with the decentralized finance protocol’s maximum Loan-to-Value (LTV) ratios and Dutch auction parameters, you can identify the exact price threshold where an asset triggers a liquidation cascade.
What are the best blockchain analytics tools for tracking whale wallets across NFTs and DeFi?
The most comprehensive tools for tracking multi-layered whale activity include Nansen for its “Smart Money” wallet classification engine and Arkham Intelligence for its entity-bundling visualizer. Additionally, Dune Analytics allows developers to write custom SQL queries that merge raw ERC-721 token transfers with ERC-20 liquidity pool events, providing a unified view of high-net-worth portfolio rotations.
How does Total Value Locked (TVL) impact NFT floor prices during market cycles?
Total Value Locked (TVL) serves as a core indicator of capital abundance or scarcity within a specific blockchain ecosystem. When protocol TVL rises sharply, it indicates inbound liquidity and surplus capital, which typically overflows into illiquid assets, driving up NFT floor prices. Conversely, during a DeFi market contraction where TVL drops, capital is often pulled from digital collectibles to cover leveraged positions, causing floor prices to fall.
Can you automate NFT liquidity scoring by parsing decentralized exchange data?
Yes, you can automate liquidity scoring by building an integration script that evaluates a collection’s sales velocity alongside the trading pool depth of its ecosystem’s native utility token on decentralized exchanges (DEXs). By tracking the liquidity depth and slippage parameters of the trading pairs required to convert an item into stablecoins, your scoring models can instantly assess how easily an investor can cash out their digital assets.
What are the technical challenges of normalization when combining cross-chain NFT data and DeFi analytics?
The primary technical hurdles are data fragmentation and structural mismatch. Different blockchains use distinct virtual machine layouts, address string formats, and block time intervals. Normalizing this data requires setting up unified data ingestion subgraphs that map disparate wallet addresses to singular user entities and align varied block timestamps into standardized UTC time candles for precise correlation analysis.